今天帶大家分析一下2020福布斯全球億萬富豪榜,看一下哪些國家有錢人最多、哪些行業(yè)比較產(chǎn)有錢人。
數(shù)據(jù)來源于福布斯富豪排行榜官網(wǎng),網(wǎng)址為:
https://www.forbeschina.com/lists/1733

寫了個爬蟲小程序,把網(wǎng)頁數(shù)據(jù)存入表格,核心代碼如下:
items=soup.find_all('tr')
result=[]for item in items[:-1]:    result.Append([i.text for i in item.find_all('td')])with open('2020年福布斯排行榜.csv', 'a+', newline='')as f:
    f_csv = csv.writer(f)    f_csv.writerows(result)

一、福布斯排行榜各國家人數(shù)占比
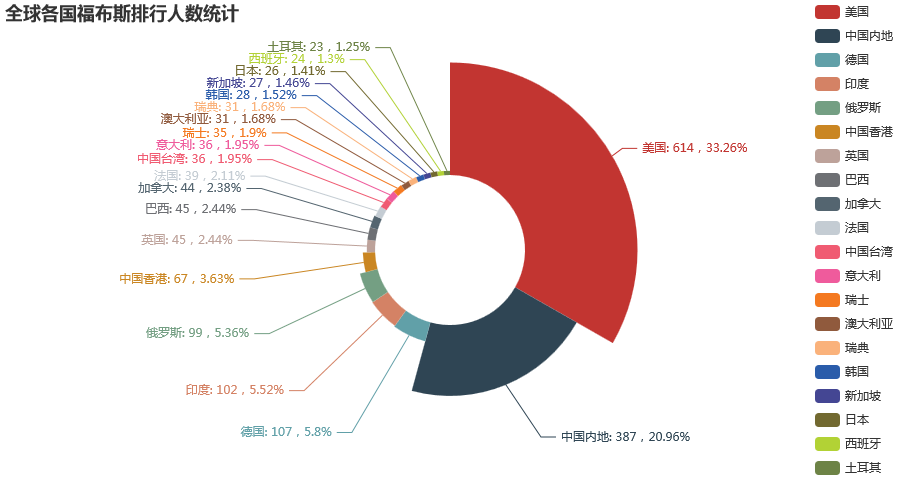
福布斯排行榜億萬富翁總共有1990名,來自全球各國,現(xiàn)在我們先統(tǒng)計一下各國人數(shù)占比情況
1.數(shù)據(jù)處理代碼
import pandas as pd
data=pd.read_csv('2020年福布斯排行榜.csv',encoding='gbk')
list_country=list(set(list(data['國家和地區(qū)'])))  #去重
dict_country={}list_country_count=[list(data['國家和地區(qū)']).count(i) for i in list_country]
for i, j in zip(list_country, list_country_count):
    dict_country[i]=jtuple_country=sorted(dict_country.items(),key=lambda x:x[1],reverse=True)
2.數(shù)據(jù)分析代碼
from pyecharts import options as opts
from pyecharts.charts import Pie
pie = (    Pie()   .add(        "",
        tuple_country[:20],
        radius=["30%", "75%"],
        rosetype="radius",
        label_opts=opts.LabelOpts(is_show=False),
    )    .set_global_opts(        title_opts=opts.TitleOpts(title="全球各國福布斯排行人數(shù)統(tǒng)計"),
        legend_opts=opts.LegendOpts(type_="scroll", pos_left="90%", orient="vertical"),
    )    .set_series_opts(label_opts=opts.LabelOpts(formatter="{b}: {c},f3fz79n%"))
)pie.render_notebook()

人數(shù)最多的國家是美國,有614名,占比33.26%,其次是中國內(nèi)地,有387名,占比20.96%,而印度和我國想比就相差甚遠,不算香港還將近是它的4倍
二、分析各國億萬富豪平均身價
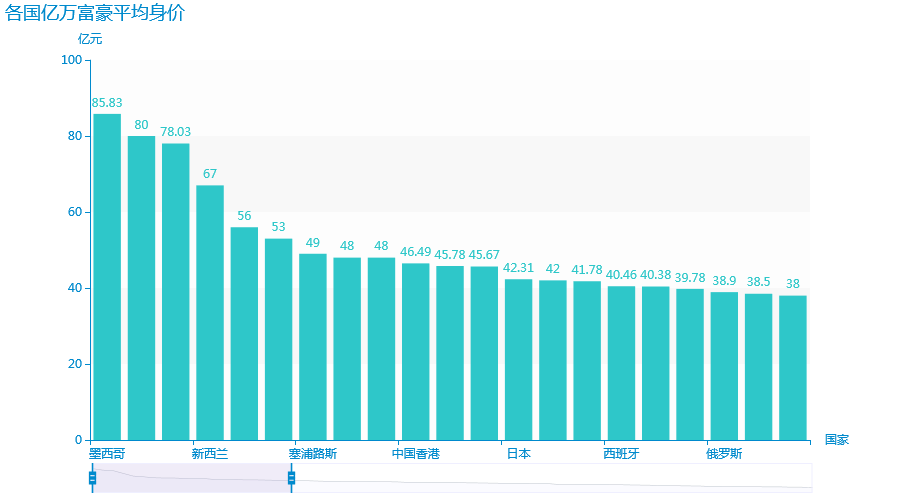
接下來想分析一下,各國億萬富豪平均身價情況
1.數(shù)據(jù)分析代碼
import pandas as pd
data=pd.read_csv('2020年福布斯排行榜.csv',encoding='gbk')
#各國占比
list_country=list(set(list(data['國家和地區(qū)'])))  #去重
dict_country={}
list_country_count=[list(data['國家和地區(qū)']).count(i) for i in list_country]
for i, j in zip(list_country, list_country_count):
    dict_country[i]=j
tuple_country=sorted(dict_country.items(),key=lambda x:x[1],reverse=True)
dict_money={}
for i,j in tuple_country:
    eve_money=round(sum(int(n) for n in list(data[data['國家和地區(qū)'].eq(i)]['財富(億美元)']))/j,2)
    dict_money[i]=eve_money
tuple_money=sorted(dict_money.items(),key=lambda x:x[1],reverse=True)
2.數(shù)據(jù)處理代碼
from pyecharts import options as opts
from pyecharts.charts import Bar
from pyecharts.globals import ThemeType
l1=[i[0] for i in tuple_money]
l2=[i[1] for i in tuple_money]
bar = (    Bar({"theme": ThemeType.macARONS})
    .add_xaxis(l1)    .add_yaxis("", l2)
    .set_global_opts(title_opts=opts.TitleOpts(title="各國億萬富豪平均身價"),
                     datazoom_opts=opts.DataZoomOpts(type_="slider"),
                     yaxis_opts=opts.AxisOpts(name="億元"),
                     xaxis_opts=opts.AxisOpts(name="國家"))
)bar.render_notebook()

墨西哥的富豪平均身價最高,為85.83億美元,其次是比利時、法國、新西蘭、尼日利亞、丹麥、塞浦路斯、美國。
三、統(tǒng)計分析哪個行業(yè)億萬富豪最多
最后,讓我們來分析一下,看看哪些行業(yè)有錢人最多
1.數(shù)據(jù)處理
import pandas as pd
data=pd.read_csv('2020年福布斯排行榜.csv',encoding='gbk')
list_country=list(set(list(data['財富來源'])))  #去重
dict_country={}list_country_count=[list(data['財富來源']).count(i) for i in list_country]
for i, j in zip(list_country, list_country_count):
    dict_country[i]=jtuple_kind=sorted(dict_country.items(),key=lambda x:x[1],reverse=True)
2.數(shù)據(jù)分析
from pyecharts import options as opts
from pyecharts.charts import Pie
from pyecharts.globals import ThemeType
pie = (    Pie()   .add(        "",
        tuple_kind[:20],
        radius=["30%", "75%"],
        rosetype="radius",
        label_opts=opts.LabelOpts(is_show=False),
    )    .set_global_opts(        title_opts=opts.TitleOpts(title="各行業(yè)億萬富豪占比統(tǒng)計"),
        legend_opts=opts.LegendOpts(type_="scroll", pos_left="90%", orient="vertical"),
    )    .set_series_opts(label_opts=opts.LabelOpts(formatter="{b}: {c},jrtxfpz%"))
)pie.render_notebook()

房地產(chǎn)不愧為龍頭老大,有167名億萬富豪,占比21.58%,前五名分別為房地產(chǎn),投資,多元化經(jīng)營,醫(yī)藥,對沖基金。
完整代碼和數(shù)據(jù)請在公眾號【Python/ target=_blank class=infotextkey>Python數(shù)據(jù)分析之禪后臺】回復福布斯獲取


