使用Matplotlib中的matplotlib.animation 方法可以繪制更好看、更有吸引力的動畫圖形,那如何把這種動畫圖形保存為Gif動畫文件或視頻文件呢?本文簡述與之相關的方法。把Python/ target=_blank class=infotextkey>Python程序中繪制的動畫圖形保存為視頻格式或gif格式文件,以便播放或發送給其他人,或者插入找文檔或網頁中。本文分兩部分,先介紹python程序繪制簡單的動態圖形或動畫(也可閱讀 《python 繪制動畫圖》這篇文章),然后再介紹如何把繪制的動態圖形或動畫保存為gif格式文件或視頻文件。
先用 Matplotlib.animation 類中的函數 FuncAnimation 創建動態圖和動畫,如動態折線、柱狀圖動畫,另外還需要使用 figure 函數和 animation 函數,這些都是python使用matplotlib繪制圖形時常用的方法。
1. 創建動態折線圖
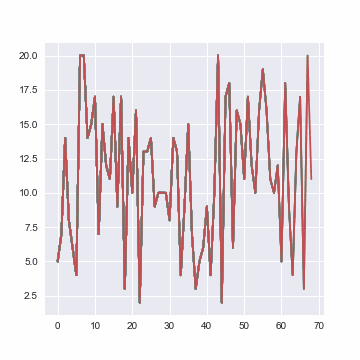
1)繪制動態折線圖,代碼如下:
import random
import matplotlib
import matplotlib.pyplot as plt
from matplotlib.animation import FuncAnimation

fig = plt.figure(figsize=(15,15))


x,y = [], []
index= count()
def animate(i):
    x.Append(next(index))
    y.append(random.randint(2,20))
    plt.style.use("ggplot")
    plt.plot(x,y)

ani = FuncAnimation(fig, animate, interval=300)
plt.show()
結果如圖1:

主要代碼行說明:
以上代碼塊中 “ani = FuncAnimation(fig, animate, interval=300)” 這一行中,FuncAnimation() 有三個參數:
1) fig,表示圖形參數
指容納plot圖形的對象, 需要創建該對象,或者調用 matplotlib.pyplot.gcf() 函數 ,表示獲得當前圖形;
2) animate 自定義函數
這是 FuncAnimation 中的動畫自定義函數, 要想獲得動畫圖形就要把該參數設定為“animate”,圖形就會根據數據持續更新,注意創建圖形和數據更新缺一不可。
3) 畫面間隔參數 interval
該參數指定畫面的更新速度,單位是毫秒。interval=1000 表示該函數運行動畫函數,并且每秒鐘更新一次。
以上代碼塊中 “plt.style.use("ggplot")” 這一行,指定動畫圖形的風格為 “ggplot”,要想了解更多的圖形風格,可使用以下代碼:
import matplotlib.pyplot as plt

print(plt.style.available)
輸入結果如下:
bmh
classic
dark_background
fast
fivethirtyeight
ggplot
grayscale
seaborn-bright
seaborn-colorblind
seaborn-dark-palette
seaborn-dark
seaborn-darkgrid
seaborn-deep
seaborn-muted
seaborn-notebook
seaborn-paper
seaborn-pastel
seaborn-poster
seaborn-talk
seaborn-ticks
seaborn-white
seaborn-whitegrid
seaborn
Solarize_Light2
tableau-colorblind10
_classic_test
上述代碼塊輸出的圖形結果中,兩個數軸都是不固定的,這與 Matplotlib Axes Setting 有關,plot函數中也沒有定義線的顏色。
2.創建動畫圖形
代碼如下:
import matplotlib.pyplot as plt
from matplotlib.animation import FuncAnimation
%matplotlib qt

fig = plt.figure(figsize=(6,4))
axes = fig.add_subplot(1,1,1)
plt.title("Dynamic Axes")

y1 = [random.randint(-10,10)+(i**1.6)/(random.randint(9,12)) for i in range(0,280,2)]
t = range(len(y1))
x,y=[], []

def animate(i):
    x.append(t[i])
    y.append((y1[i]))
    plt.xlim(i-30,i+3)
    axes.set_ylim(y1[i]-100, y1[i]+100)
    plt.plot(x,y, scaley=True, scalex=True, color="red")

anim = FuncAnimation(fig, animate, interval=100)
輸出結果如圖2:
圖2 動態數軸動畫
保存動態圖形
保存Matplotlib繪制的動畫可能會出現一些小故障。下面介紹一下常用的選項和參數,既可以節省保存動畫所需的時間,又可以盡可能地減少故障;可以把python代碼生成的動畫保存為個人需要的格式,如gif、mp4、avi、mov等文件格式,這取決于保存時選擇對應的參數。
- 保存為GIF文件--圖1,代碼如下:
f = r"d:\animation.gif"
writergif = animation.PillowWriter(fps=30)
anim.save(f, writer=writergif)
這段代碼中,常用的選項有 ImageMagick 和 PillowWriter。
對于windows 操作系統來說,使用 ImageMagick 方法一般要先安裝相關程序包,并且在保存動畫為 GIF 文件時,建議使用 Write Instance,還是比較復雜;如果是Unix操作系統,ImageMagick一般情況下都已經安裝了,使用 ImageMagick 方法 就方便。因此,建議windows用戶使用 PillowWriter 方法。
定義 gif 圖形的幀數:
修改 FuncAnimation函數中的 save_count 參數的值,設定 GIF 文件的幀數,默認為 100 幀,代碼如下:
anim = animation.FuncAnimation(figure, func=update_figure, fargs=(bar_rects, iteration), frames=generator, interval=100, repeat=True, save_count=1500)
示例代碼中,把GIF文件的幀數修改為 1500 幀。
- 保存為視頻文件
把調用matplotlib的方法生成的動畫保存為視頻文件,需要 ffmpeg.exe 安裝程序,可到官網下載,如下圖:
特別注意,安裝后要把該運行程序的路徑 ffmpegbinffmpeg.exe 添加到環境變量中,此路徑一定要正確 并且一定是指向可執行文件,而不僅僅是該文件所在的文件夾。在生成動畫的python程序塊中要加入以下代碼行:
import matplotlib as mpl
mpl.rcParams['animation.ffmpeg_path'] = r'C:\Users\xx\Desktop\ffmpeg\bin\ffmpeg.exe'
接下來,把 matplotlib 繪制的動畫保存為 mp4 格式的視頻文件,代碼如下:
f = r"d:\animation.mp4"
writervideo = animation.FFMpegWriter(fps=60)
anim.save(f, writer=writervideo)
定義視頻的尺寸:
視頻的尺寸就是用 matplotlib 工具包繪制圖形的窗口大小,調整對應窗口的大小即刻,示例代碼如下:
plt.subplots(figsize=(12,8))
(本文結束)


